Hidden layers & backpropagation
Reader-friendly version of the 39 lecture slides: the lecture content in normal flow, with figure descriptions and data tables where the figure carries data. Open the presentation.
Slide 1

Hidden layers & backpropagation
Slide 2
Last lecture: one neuron that learns
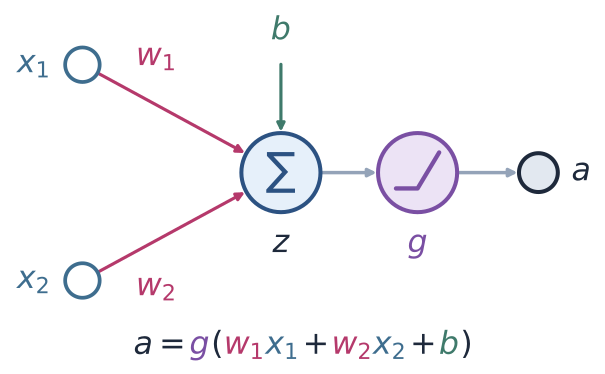
A model neuron with two inputs, x1 and x2, with weights w1 and w2, summed with a bias b into z, passed through the nonlinearity g, giving the output a = g(w1 x1 + w2 x2 + b)
Open full-size figure- Perceptron: , labels
- Delta rule: , squared error
- Logistic regression: , cross-entropy
- The model neuron: a weighted sum , then a nonlinearity . Its weights set one decision boundary
- Learning: the loss measures the gap between the output and the target ; the weights move against its gradient
- All three rules of last lecture share one update: learning rate × error × input
Slide 3
Learning the weights: start anywhere, walk downhill
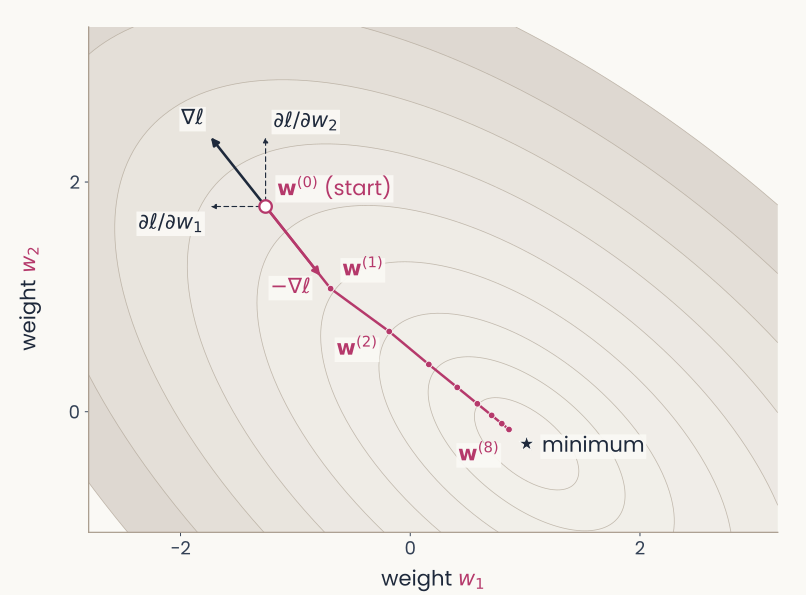
Contours of the loss over the two weights w1 and w2, with the minimum marked by a star. At the start w(0), at the upper left, a dark arrow shows the gradient pointing uphill, with dashed arrows for its two components, the partial derivatives with respect to w1 and w2. A magenta arrow labelled minus the gradient points the other way, to w(1); eight dots w(0) to w(8) step down toward the minimum
Open full-size figure- Each pair has a loss : the squared error , averaged over a small training set; contours join equal losses
- Start at small random weights . The gradient points uphill, toward higher loss
- Each step is a weight update against the gradient; the learning rate sets its size
- For this neuron the loss is convex, a bowl with a single minimum. From any start, small enough steps reach the bottom
Slide 4
You never see the whole landscape
- The contour map was drawn by computing for every pair on a grid: easy with only 2 weights
- With 100 weights and only 10 values tried per weight, the grid has points. Real networks have millions of weights: the map can never be drawn
- Gradient descent never needs the map. At the current weights it computes the gradient: for each weight, which way to move to lower , and how strongly
- Why that is cheap: the gradient is a formula, worked out once with calculus (next slides). Its cost grows in proportion to the number of weights, not exponentially as the grid does
- Each small step lowers the loss. A step computed from one example, or from a small batch of examples (minibatches, next lecture), lowers it on average
Slide 5
The chain rule, one link at a time
- The weights change the loss only through a chain:
- Chain rule of calculus: if and , then . A longer chain multiplies one slope per link. This gives the gradient of the loss with respect to each weight
- Link : , set by the loss
- Link : , the slope of the nonlinearity
- Link : , because
- Multiply the three slopes and you have the gradient
Slide 6
The three links, worked out: delta rule
Output (no nonlinearity), loss
- The error gives the rule its name. Step against the gradient: , the delta rule
- Backpropagation, later, writes the error with the opposite sign:
Slide 7
The three links, worked out: logistic regression
Output , loss
- The sigmoid's slope cancels the loss's denominator: the same form as the delta rule
Slide 8
The perceptron is gradient descent after all
- Last lecture: Rosenblatt's rule was a heuristic. On each mistake, add (labels ). Its threshold output has no slope, so the chain rule cannot derive it
- Now treat the output as linear, , and score it with : 0 when the example is on the correct side, growing with how far a mistake is on the wrong side
- The gradient is on a mistake, 0 otherwise. Stepping against it gives exactly Rosenblatt's rule
- The heuristic is gradient descent on this loss, the hinge loss with a margin of 0
Slide 9
Why more than one layer?
Slide 10
One line fails on XOR; simpler rules do not
- XOR (first panel below): one neuron, one line, at best 3 of the 4 points right
- But XOR is built from simpler rules, each one perceptron with one line (other panels):
- Stack them: OR and NOT-AND in a first layer, a neuron combining them in a second
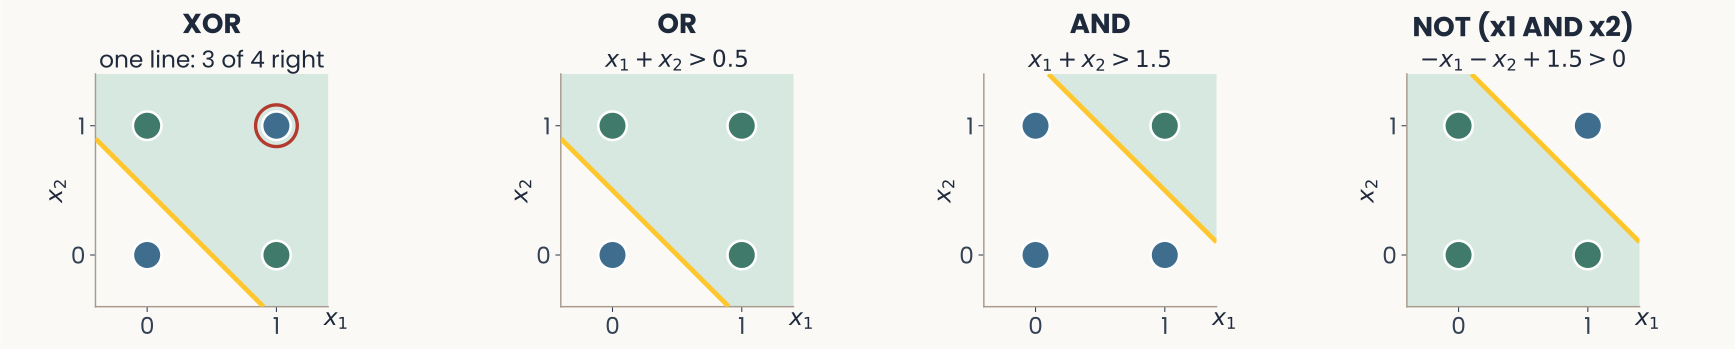
Four small panels. XOR: the four inputs with the best single line, 3 of 4 right, the wrong point (1,1) circled. OR: the four inputs, with (0,1), (1,0) and (1,1) green and (0,0) blue, separated by the gold line x1 + x2 = 0.5. AND: only (1,1) green, separated by the line x1 + x2 = 1.5. NOT (x1 AND x2): the four inputs, green except (1,1) in blue, separated by the gold line x1 + x2 = 1.5, shaded below it
Open full-size figureSlide 11
Stack them: two hidden units and one output
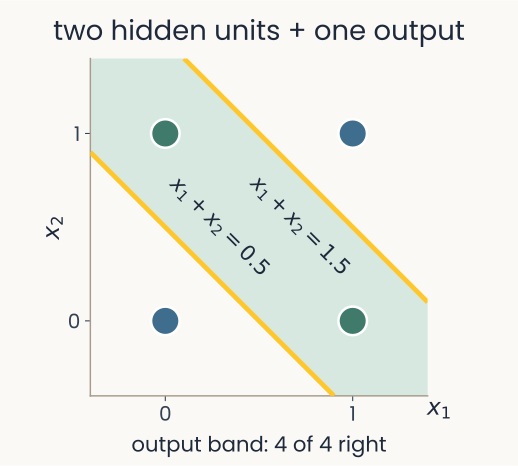
The four XOR points, blue at (0,0) and (1,1), green at (0,1) and (1,0). Two hidden units, then one output: two gold lines, x1 + x2 = 0.5 and x1 + x2 = 1.5, bound a band that is the output's green region, and all 4 points are right
Open full-size figure- Two hidden units, one like OR and one like AND; the output adds OR and subtracts AND (the NOT), so it fires in the band between their lines: all 4 right
- A multilayer perceptron (MLP) stacks layers: each layer's outputs are the next layer's inputs, and every unit takes a weighted sum, then a nonlinearity. Stacked neurons draw boundaries that one line cannot
Slide 12
The hidden layer re-represents the input
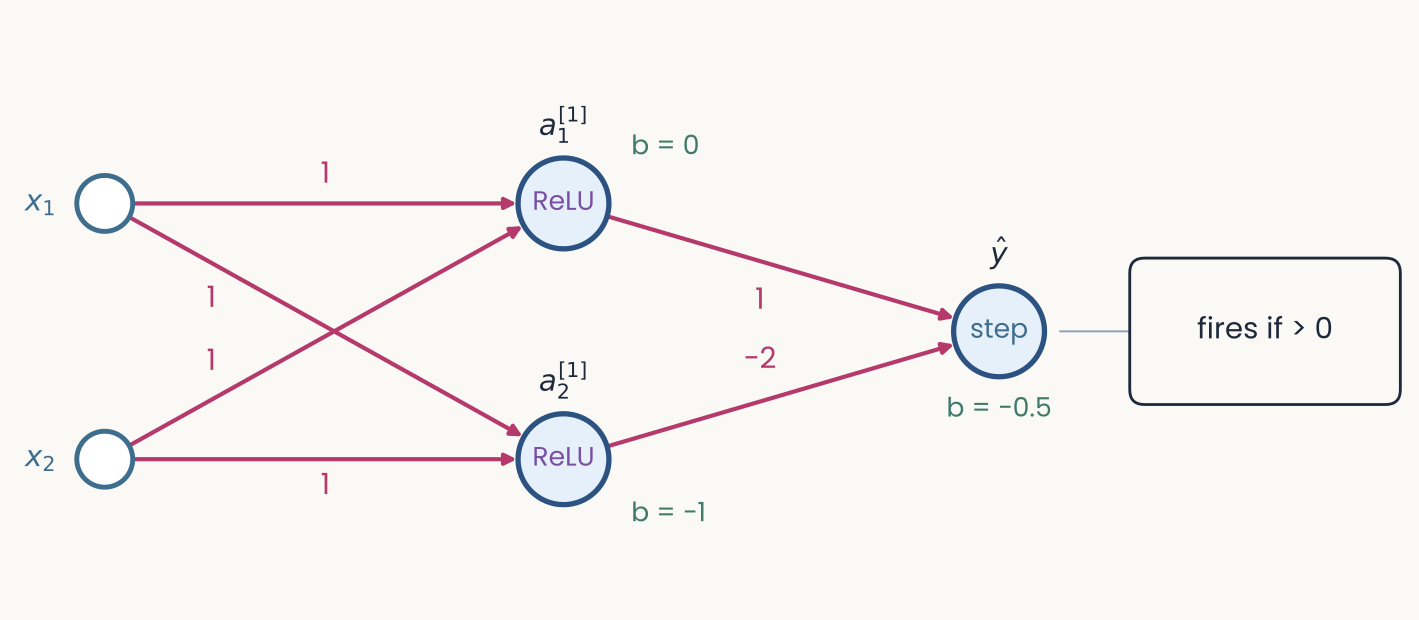
The XOR network of the previous slide: inputs x1 and x2, weights of 1 into both ReLU hidden units, biases 0 and minus 1, output weights 1 and minus 2, output is a step unit with bias minus 0.5
Open full-size figure- : output of unit in layer (layer 1 is hidden). With ReLUs, unit 1 acts like OR, unit 2 like AND
- In the plane of , (0,1) and (1,0) land on one point: one line separates the classes
- The hidden layer turns XOR into a linearly separable problem for the readout
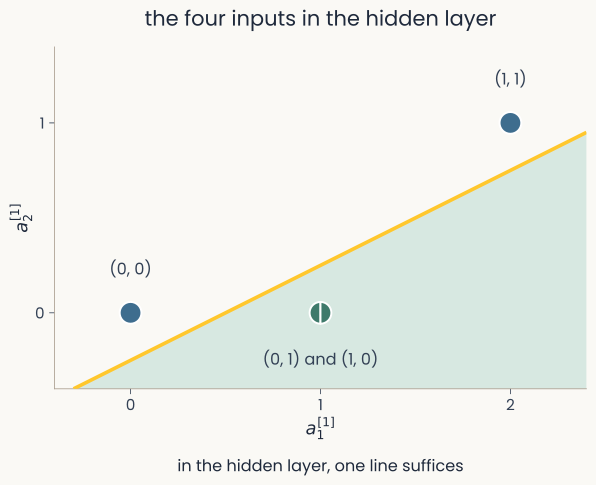
The four XOR inputs in hidden-unit coordinates a1 and a2 of layer 1: blue (0,0) at the origin, green (0,1) and (1,0) together at (1,0), blue (1,1) at (2,1). One solid gold line separates the green point, on the shaded side, from the two blue points. The caption reads: in the hidden layer, one line suffices
Open full-size figureSlide 13
Why the ReLU matters: linear layers collapse into one
- Remove the ReLUs from the XOR network: and
- The output's sum becomes : one weighted sum of the inputs, so one line again, and XOR is lost
- A weighted sum of weighted sums is a weighted sum. Without a nonlinearity, stacking adds nothing
- With the ReLU, unit 2 stays at 0 until . That bend is what turns two lines into a band
Slide 14
With hidden layers, the landscape is no longer a bowl
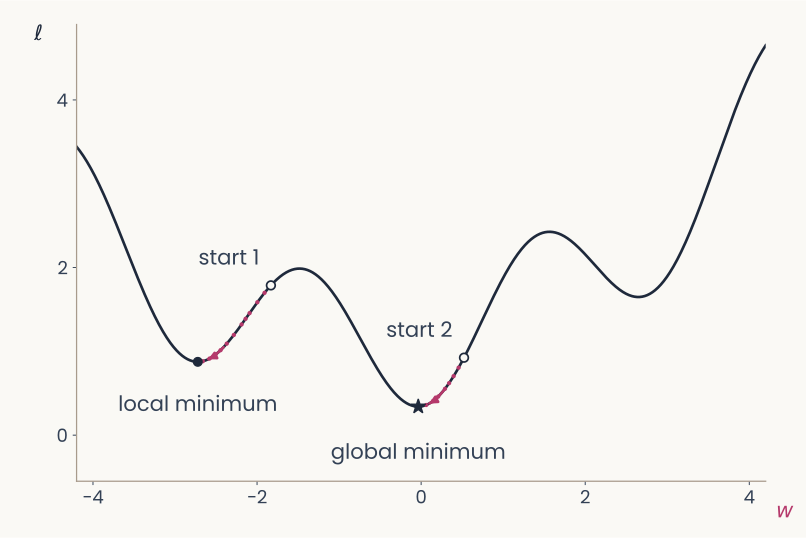
A loss curve over one weight w with three valleys of different depths. Two starting points chosen at random; gradient descent from each follows the curve downhill to a different valley: one reaches the deepest valley, marked global minimum, the other stops in a shallower valley, marked local minimum
Open full-size figure- Once a network has hidden layers, the loss is not convex: it has many valleys, local minima
- Gradient descent still goes down from wherever it starts. Different starts can end in different minima; none is guaranteed best
- In practice, large networks usually reach a minimum that works well. That is an observation, not a guarantee
Slide 15
How can a hidden unit learn when nothing tells it what to output?
Slide 16
Backpropagation: a long and disputed history
- 1958: Rosenblatt's perceptron learns its weights from examples, but only one layer of them
- 1969: Minsky & Papert show that a perceptron cannot compute XOR. No widely known method trains hidden layers, and interest in neural networks fades
- 1970–1974: Linnainmaa, studying rounding errors in computer programs, computes all the derivatives of a long calculation in one backward sweep. Werbos: general models in 1974, neural networks in 1982
- 1986: Rumelhart, Hinton & Williams show that hidden units trained this way learn useful internal representations. Their Nature paper made backprop the standard method
- Who deserves the credit is still argued. Hinton's 2024 Nobel Prize in Physics, shared with Hopfield, cited a different kind of network, the Boltzmann machine, not backprop. His 2018 Turing Award, shared with Bengio and LeCun, was for deep learning as a whole
Slide 17
Notation for a network with layers
- Layers are numbered: the input is layer 0, ; the output is the last layer, , so ( = number of layers)
- Unit of layer : weighted sum , output
- : one weight (a number), into unit of layer from unit of the layer below: , with bias . Layer 's weights form the matrix
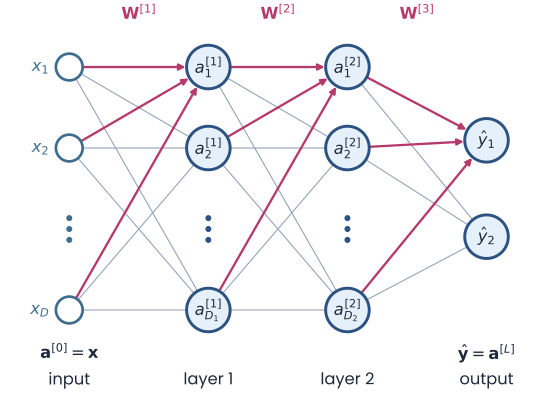
A fully connected network drawn left to right: inputs x1 to xD (a superscript 0 equals x), hidden layer 1 with units a superscript 1, hidden layer 2 with units a superscript 2, and an output layer y-hat. Every unit connects to every unit of the next layer; the weight matrices W superscript 1, 2 and 3 label the gaps
Open full-size figureSlide 18
Nudge a hidden unit and follow the effect
How does the loss change if hidden unit 's weighted sum grows by a small amount ?
| follows the chain | in math | |
|---|---|---|
| 1 | its output moves by its slope × | |
| 2 | the output unit's sum moves by the connecting weight × that | |
| 3 | the loss moves by the output's error × that, as in logistic regression |
- The loss change per unit nudge is the hidden unit's error: , the output error sent back through the weight
- It plays the role plays for the output. Each weight into the hidden unit changes by error × input:
Slide 19
Backpropagation: the recipe, for any network
- Forward: run the input through and keep every weighted sum and output
- Output error: the output has a target, so its error is
- Backward: each hidden unit's error = the errors of the units it feeds, each × the weight to them, all × its own slope:
- Gradients: each weight's gradient = error of the unit it enters × its input:
- Why backward: step 3 for one layer needs the errors of the layer above. Start at the output and work back, layer by layer
Slide 20
Where the recipe comes from: the chain rule
- A unit's error is the slope of the loss with respect to its weighted sum:
- Output unit: chain through (logistic regression, earlier):
- Hidden unit : changes the loss through every unit it feeds, so the chains add up:
- Each formula of the recipe is the chain rule, with the slopes we already know
Slide 21
Back to XOR: learn the weights from random ones
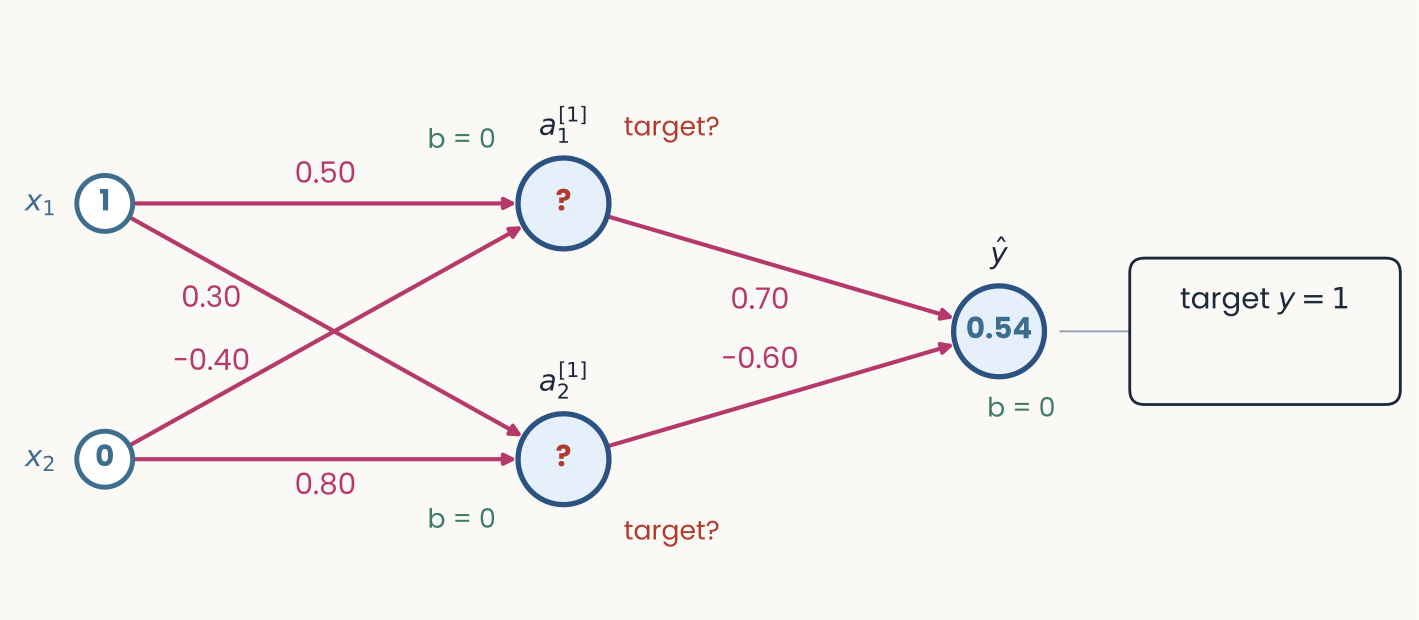
A 2-2-1 network drawn left to right. Inputs x1 = 1 and x2 = 0; six magenta weights; two hidden units marked with red question marks and the words target?; an output unit at 0.54; a box on the right reading target y = 1
Open full-size figure- Above: the XOR network before training, with small random weights instead of the hand-set ones. Hidden units ReLU. Output: a sigmoid with the cross-entropy, so is a probability (a linear output with squared error would also train; threshold only to read the class)
- Input (1, 0), target 1: the output is . Four steps compute every gradient
Slide 23
Step 1: the forward pass
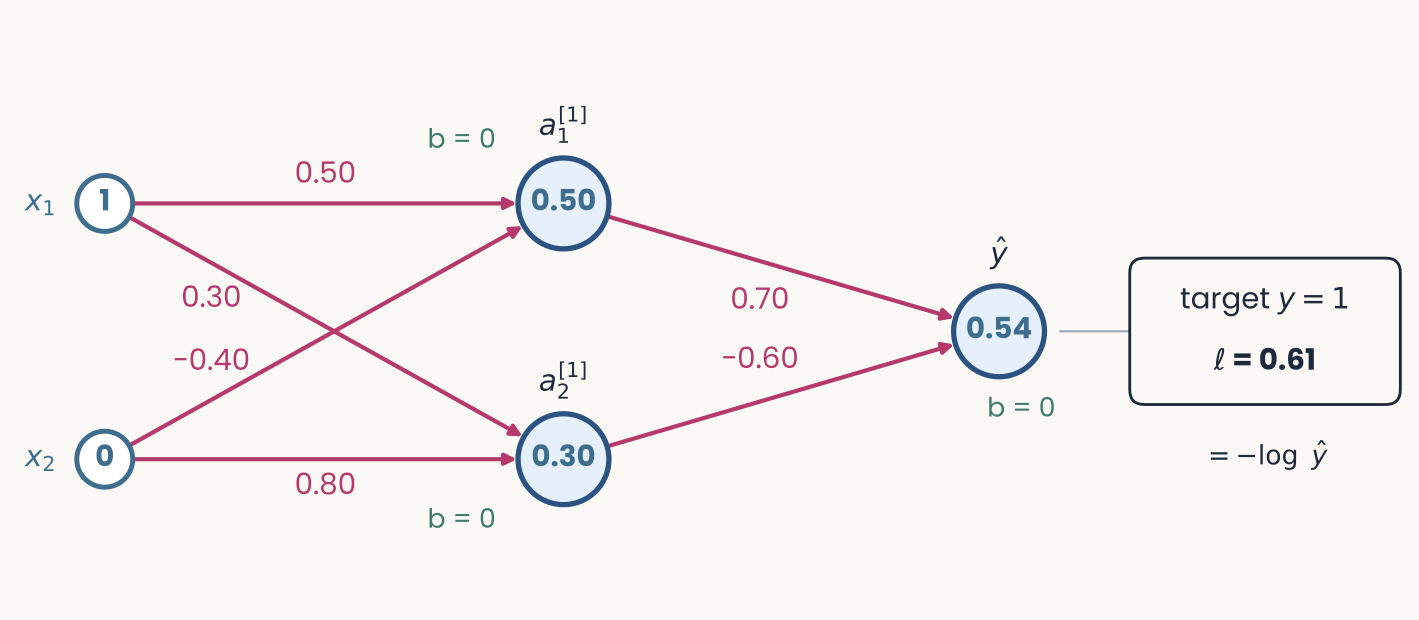
The same network after the forward pass. The box on the right now reads target y = 1, loss 0.61, and underneath, equals minus log y hat
Open full-size figure- Hidden: ,
- Output: ,
- Loss:
Slide 24
Step 2: the error at the output
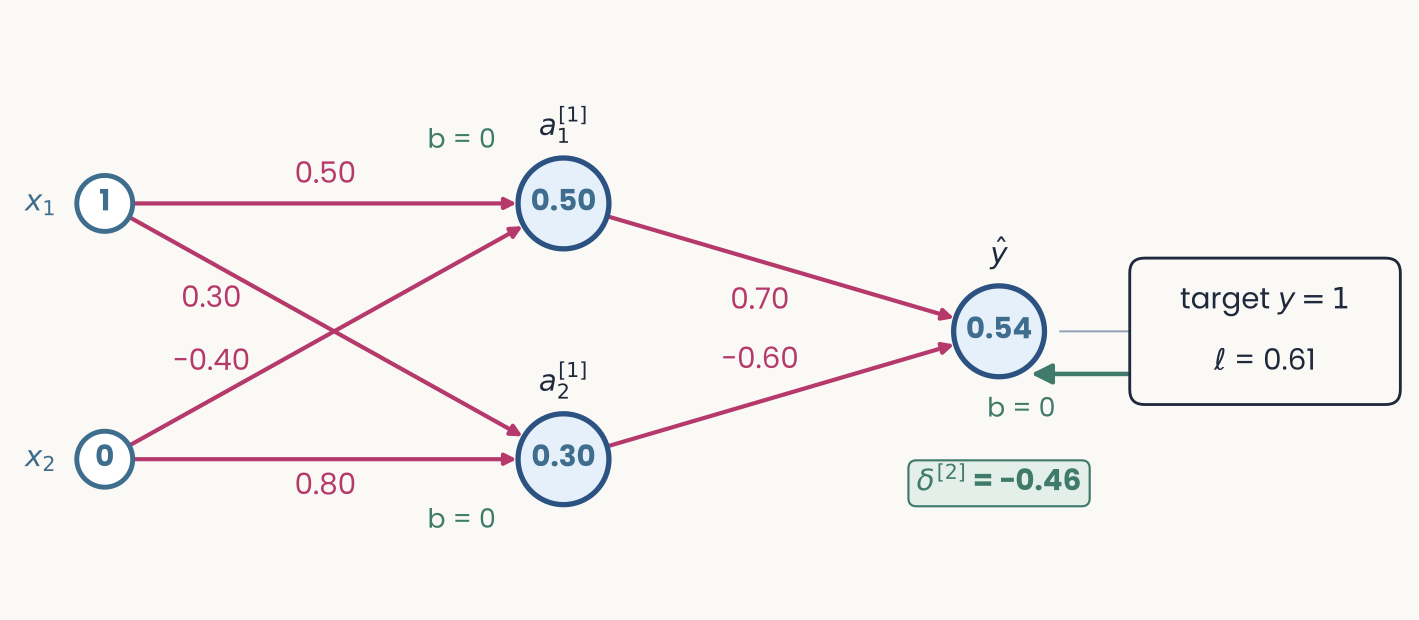
The same network. A green arrow runs back from the loss box to the output unit, and a green tag under the output reads delta = minus 0.46
Open full-size figure- Sigmoid + cross-entropy: error = prediction − target:
- Negative: the output was too low and should rise. Every later step builds on this output error
Slide 25
Step 3: send the error backward
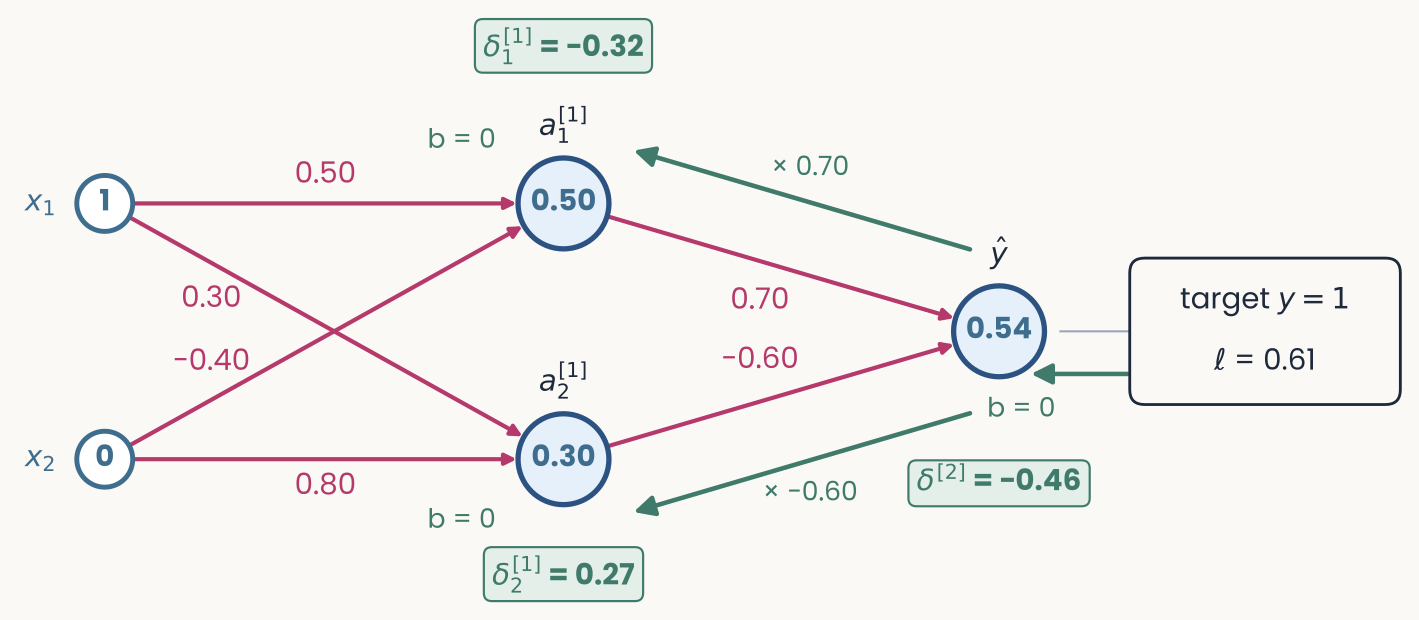
The same network. Green arrows run back from the output to each hidden unit, labelled times 0.70 and times minus 0.60. Green tags read delta 1 = minus 0.32 next to a1 of layer 1 and delta 2 = 0.27 next to a2 of layer 1
Open full-size figure- A hidden unit's error = output error × the linking weight × its ReLU slope (1 if on, 0 if off)
- ;
- Each hidden unit gets its own error, even its own sign: should have been higher, lower
Slide 26
Step 4: every gradient is error × activity
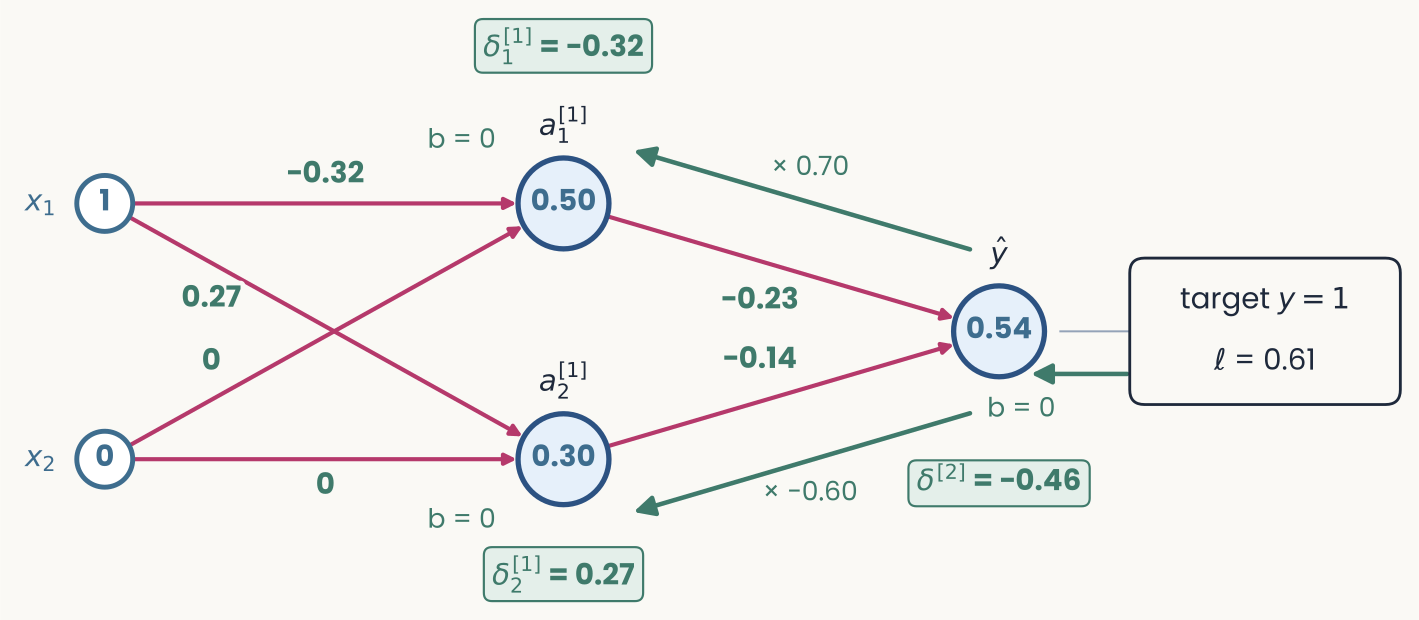
The same network with the weights replaced by their gradients in green: minus 0.32 and 0.27 on the connections from x1, 0 on both connections from x2, minus 0.23 and minus 0.14 on the connections into the output. The error tags stay in place
Open full-size figure- gradient = error × activity:
- Weights from get 0, since . Each bias gets its unit's error: , ,
- One step with on all weights and biases: rises from 0.54 to 0.82
Slide 27
Try it: train a small network on 2-D data
- Compare one and two hidden units on XOR. Every weight is learned by the same four steps
Slide 28
Many classes: one output per class, then a softmax
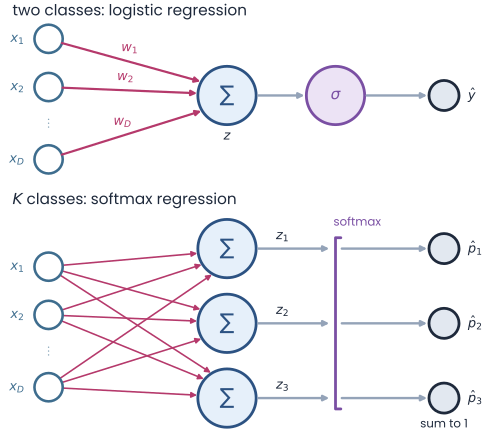
Two panels stacked. Top, two classes: inputs x1 to xD, each with its weight, summed into z, passed through a sigmoid to give one probability y-hat (logistic regression). Bottom, K classes: the same inputs feed three output neurons, each with its own weight vector w1, w2, w3, giving logits z1 to z3; a softmax turns them into three probabilities p-hat 1 to 3 that sum to 1 (softmax regression)
Open full-size figure- Top: one output, one probability. Bottom, classes: output units with their own weights, one weighted sum per class, the logits
- Softmax: , which sum to 1
- Loss ; error
- Logits : ; if class 1 is true
- Right and confident, ; wrong and confident, grows without bound
Slide 29
The training loop
model   = nn.Linear(D, K)                  # D inputs, one logit for each of K classes
loss_fn = nn.CrossEntropyLoss()            # softmax + cross-entropy, averaged
opt     = torch.optim.SGD(model.parameters(), lr=0.1)   # SGD: a plain gradient step
for epoch in range(num_epochs):            # one epoch = one pass over the training set
    opt.zero_grad()                        # 1. clear the old gradients
    logits = model(X_train)                # 2. forward: logits for every image
    loss = loss_fn(logits, y_train)        # 3. the average cross-entropy
    loss.backward()                        # 4. gradient of the loss for every weight
    opt.step()                             # 5. update: w <- w - lr * gradient
with torch.no_grad():                      # evaluate on held-out images
    acc = (model(X_test).argmax(1) == y_test).float().mean()
- One step: a batch of examples forward, their average loss, its gradient, an update. One epoch: every training example once. The
modelline alone sets a readout or a hidden layer backward()computes the gradients.opt, the optimizer, turns them into weight changes instep()- Last lecture's learning cycle, now as code: forward, loss, gradient, step, repeat
Slide 30
Autograd: you never write the backward pass
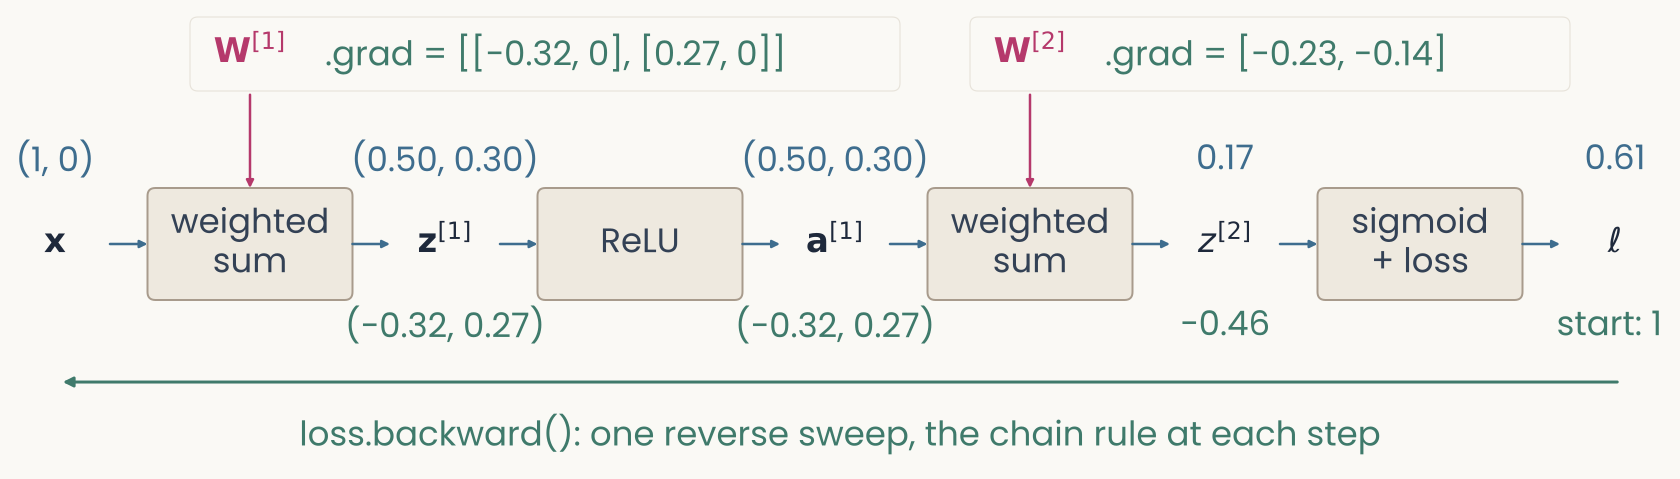
The worked example as PyTorch records it: x, a weighted sum with W1, z1, ReLU, a1, a weighted sum with W2, z2, and a sigmoid-plus-loss box giving ℓ. Forward values in blue above each quantity, gradients in green below, starting from 1 under ℓ; a long green arrow runs right to left, labelled loss.backward, one reverse sweep, the chain rule at each step. W1 and W2 carry their .grad values
Open full-size figure- PyTorch's automatic differentiation (autograd) records the forward pass as a computational graph: the operations that ran, and the values each one used
loss.backward()sweeps the graph in reverse: output error, hidden errors, then each parameter's gradient, stored in its.grad.opt.step()applies the update
Slide 31
Reuse a trained network: transfer learning
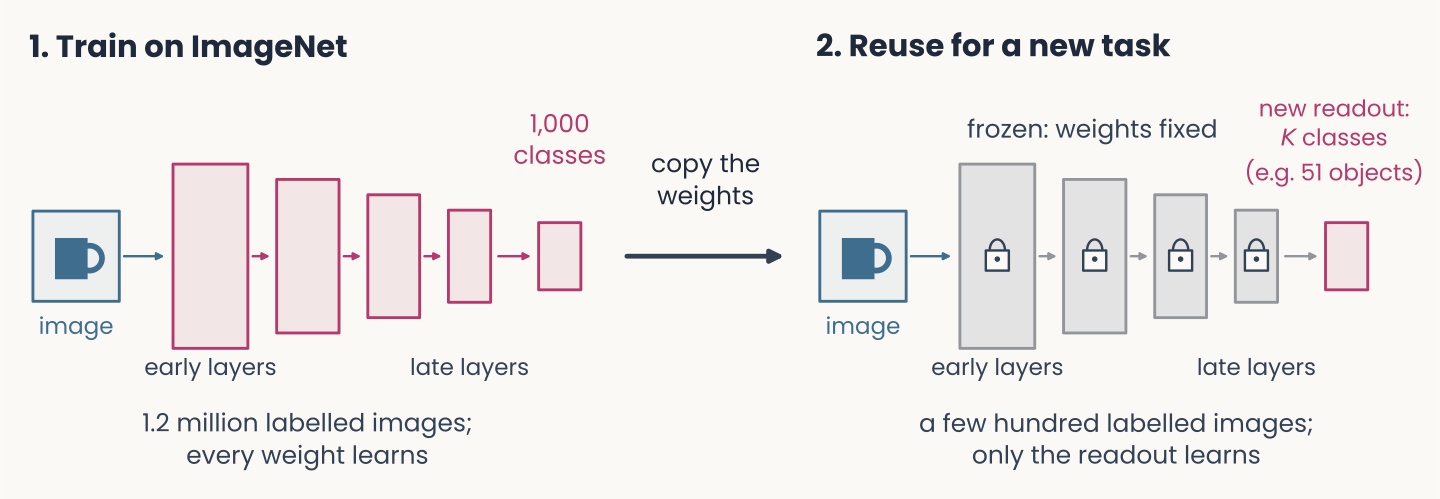
Two panels joined by an arrow labelled copy the weights. Left, 1, train on ImageNet: an image goes through a stack of layers, from early to late, to an output of 1,000 classes; 1.2 million labelled images, every weight learns. Right, 2, reuse for a new task: the same stack in grey with padlocks, frozen, weights fixed; the old output is replaced by a new readout for K classes, for example 51 objects; a few hundred labelled images, only the readout learns
Open full-size figure- Train once on a large dataset; freeze the layers and train only a new readout for the new task. A few hundred images can be enough
Slide 32
Train only part of a network
model = nn.Sequential(nn.Linear(D, 64), nn.ReLU(), nn.Linear(64, K))
model.load_state_dict(torch.load("trained.pt"))   # weights trained earlier
for p in model[0].parameters():            # the hidden layer
    p.requires_grad = False                # no gradients: these weights stay fixed
opt = torch.optim.Adam(model[2].parameters(), lr=1e-3)   # Adam: an optimizer, next lecture
model[0]is the first layer;.parameters()lists its weights and biases. The loop setsrequires_grad = Falseon each: autograd computes no gradient for them, so they stay frozen- The optimizer is given only
model[2], the readout: only its weights learn - Readout only: cheap. It shows what a trained readout can find in the hidden layer's fixed responses
- Every weight: backpropagation also changes the hidden layer, so its responses to the images change too
- Same data, same loss: only the set of weights allowed to move differs
Slide 33
Recap
- One neuron: every learning rule moves the weights against the gradient of its loss, and the chain rule gives that gradient
- Hidden layers: one neuron draws one line. Layers with a nonlinearity re-represent the inputs, so that a readout can separate classes no single line could
- Backpropagation: forward pass, error at the output (), error sent backward through the weights, and every gradient is error × activity. Autograd runs these steps for you
- The training loop: forward, loss,
backward(),step(), repeated over epochs, with a softmax output for many classes. Freezing trained layers reuses them for a new task
Slide 34
Further reading for the research trail
Optional: a few research-trail entries over the semester. Any paper mentioned in any lecture qualifies, including those on the Going further slides that follow.
- Crick Nature 1989: why backprop, as written, is unlikely to be how the brain learns
- Lillicrap et al. Nat Rev Neurosci 2020: how a brain could approximate the error signal of step 3 without copying the weights backward
- Lillicrap, Cownden, Tweed & Akerman Nat Commun 2016: random feedback weights can replace the backward weights
- Francioni et al. Nature 2026: neurons with opposite effects get opposite-sign error signals
- Raugel et al. arXiv 2026: backprop gradients, not only activations, predict fMRI
Slide 35
Minute paper
Submit on Canvas → Minute papers → Minute Paper 10 (access code read out in class).
Write three brief points in your own words:
- In plain words, no equations: why can a multilayer perceptron solve XOR when a single neuron cannot?
- Something you do not yet understand, or a question still open
- Another idea you found interesting, and why it matters for brains, behavior or AI
Credit for a thoughtful attempt, not for being correct.
Slide 36
Going further
Optional slides, beyond the core of the lecture
Slide 37
Weight transport: must feedback copy the weights?
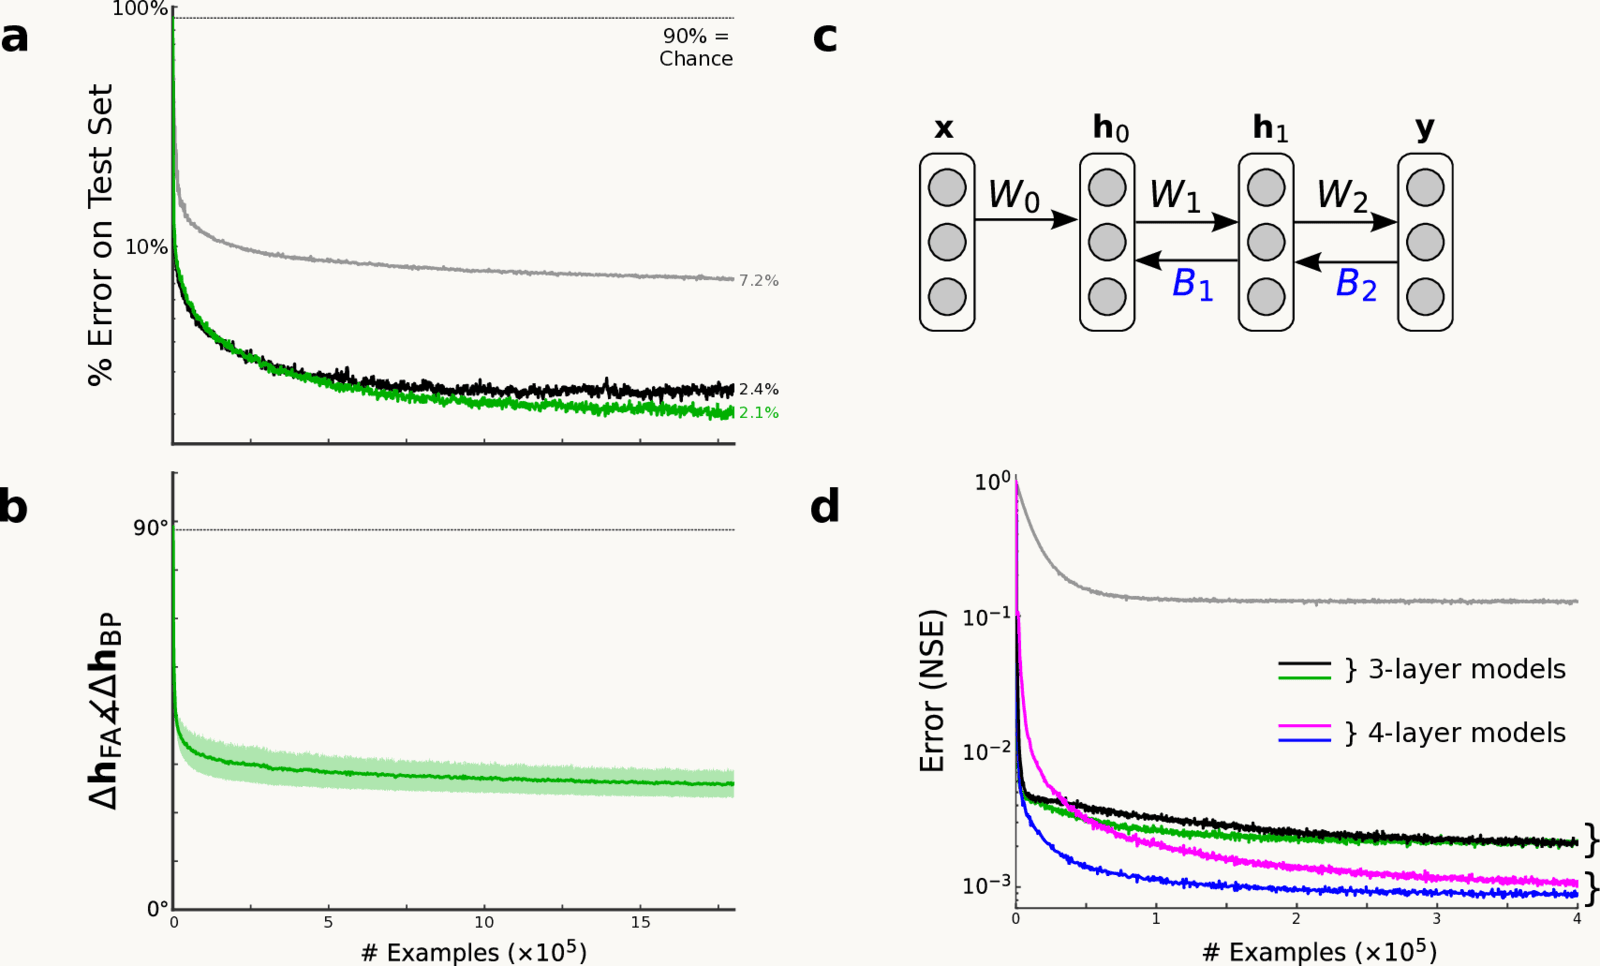
Feedback alignment, from Lillicrap et al. 2016, Fig. 2: with fixed random feedback weights the hidden-unit updates come within 90 degrees of backprop's, and the MNIST test error of feedback alignment nearly matches backprop's
Open full-size figure- Backprop sends the error back through the forward weights , so feedback synapses would have to copy them (weight transport)
- With fixed random feedback weights instead, the forward weights adapt until the hidden units' updates point within of backprop's (panel b)
- On MNIST (handwritten digits), 2.1% test error vs 2.4% for backprop
Slide 38
Error signals in dendrites, one per neuron
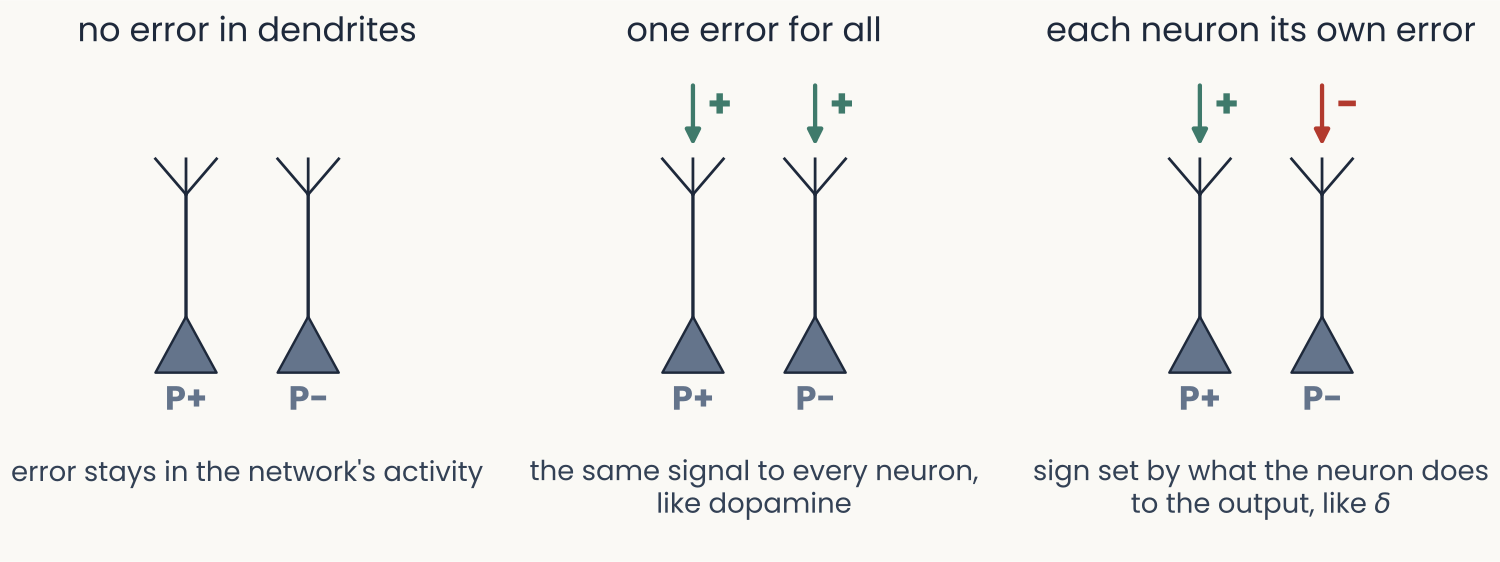
Three panels, each with two pyramidal neurons labelled P+ and P minus, with an apical dendrite rising to a tuft. No error in dendrites: no arrows. One error for all: the same green plus arrow onto both tufts, the same signal to every neuron, like dopamine. Each neuron its own error: a green plus arrow onto P+ and a red minus arrow onto P minus, sign set by what the neuron does to the output, like delta
Open full-size figure- Mice turned a grating with a brain–computer interface (BCI): a few layer-5 neurons (P+) rotated it toward the target, others (P−) away
- Their apical dendrites carried error-related signals of opposite sign, matching each group's effect: each neuron its own error. Silencing them disrupted learning (caveat: a BCI task)
Slide 39
Do backprop's gradients follow the brain's hierarchy?
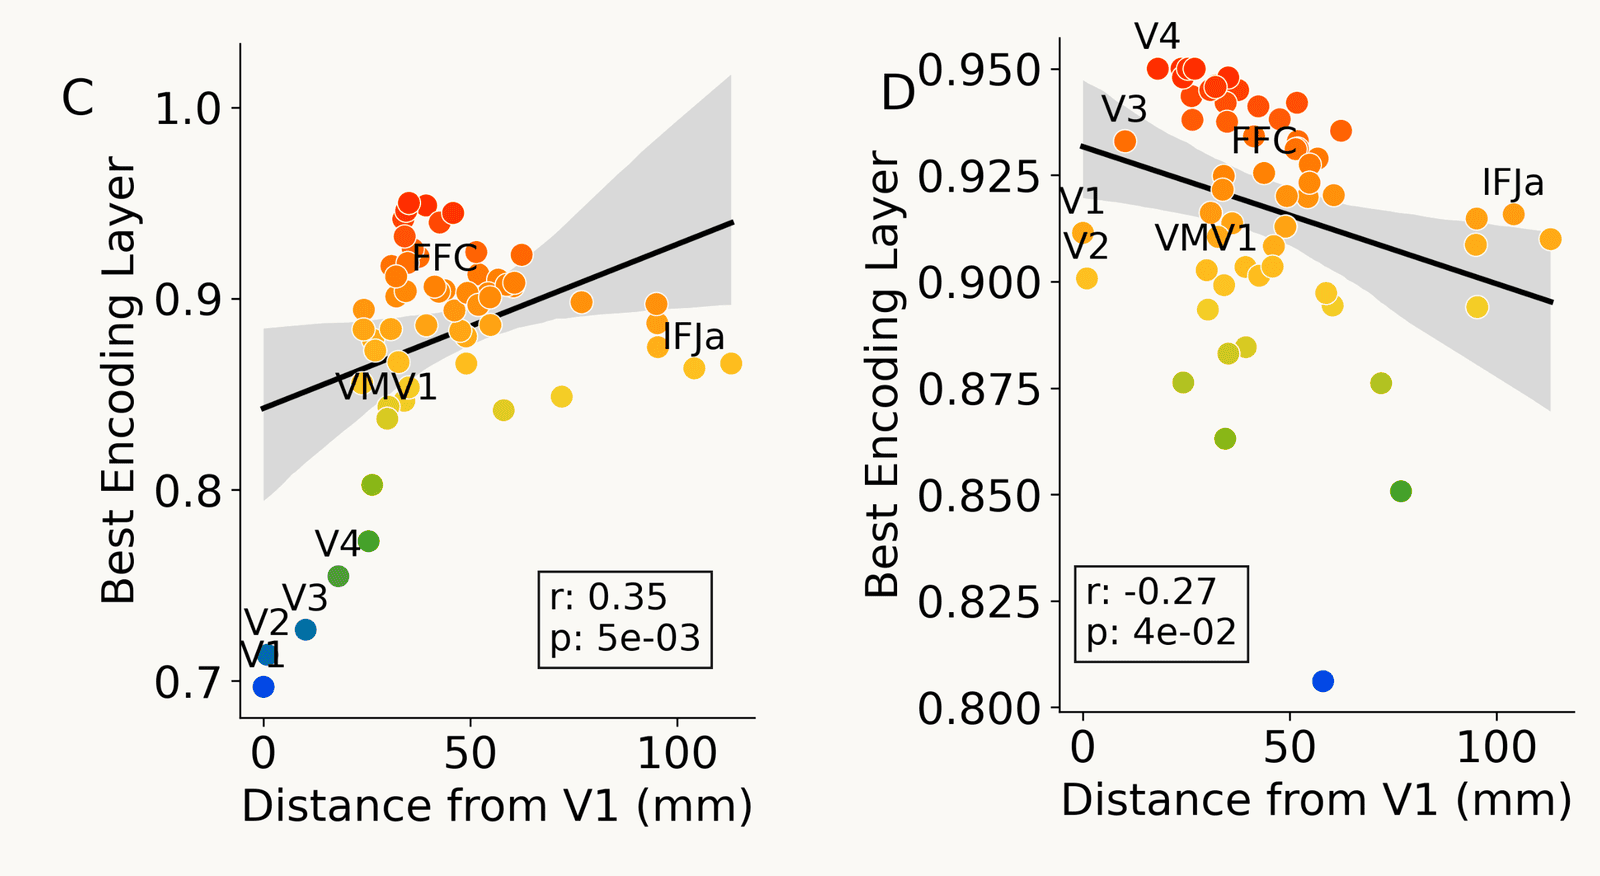
Two scatter plots, one point per brain region, horizontal axis distance from V1 in millimetres (0 to about 110), vertical axis the network layer that best predicts the region, as a fraction of network depth. Left, panel C, forward activations: V1, V2, V3 and V4 sit low near 0.7 to 0.77, regions farther from V1 are best predicted by deeper layers, and the fitted line rises (r = 0.35, p = 5e-03). Right, panel D, backpropagated gradients: V1 and V2 sit near 0.90 to 0.91, V4 near 0.95, and the fitted line falls with distance (r = -0.27, p = 4e-02)
Open full-size figure- Encoding models predicted fMRI from a network's activations and, separately, from its backpropagated gradients
- Left, activations: regions farther from V1 match deeper layers. Right, gradients: the trend reverses
- Shared representations, different ways of learning them?